Seniors for Biden? Looking Into the Polls Among Another Key Subgroup
A Commentary By Kyle Kondik
KEY POINTS FROM THIS ARTICLE
— Horse race presidential polling has shown some significant weaknesses for President Biden among at least a couple of key subgroups: young people and Black voters.
— However, some polls have also shown Biden doing unusually well among senior citizens.
— The oldest voters have generally voted to the right of the national vote in recent cycles, and that is probably what we should expect in 2024 as well, despite these polls.
The senior citizen vote in 2024
In a couple of previous Crystal Ball articles, we have looked at a couple of key groups where it’s possible that polls are painting an overly rosy picture for former President Donald Trump in his rematch with President Joe Biden. Last week, Senior Columnist Alan Abramowitz looked at Trump’s unusually strong polling with Black voters, an overwhelmingly Democratic voting bloc. Late last year, I wrote about Trump’s relatively good polling with young voters, another group that is usually Democratic-leaning (Trump’s strength and/or Biden’s weakness with younger voters still shows up in a lot of polls).
But there’s another group with whom Biden, not Trump, is doing unusually and perhaps unrealistically well in at least some recent polling: voters over the age of 65.
Table 1 shows some recent national polls that provided detailed crosstab information about voters aged 65 and over. The least-recent poll in the group is the widely-cited New York Times/Siena College poll from late February; the others were fielded from mid-to-late March.
Table 1: Vote intention of 65+ voters in recent Biden vs. Trump polls
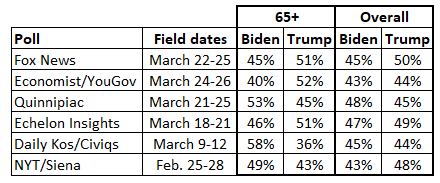
Notes: All are Biden versus Trump national head-to-head polls, with the exception of Economist/YouGov, which used the full ballot. All feature results for registered voters except for Echelon, which is of likely voters.
Source: Daily Kos/Civiqs, New York Times/Siena College, Echelon Insights, Quinnipiac University, Fox News, Economist/YouGov
All of these polls included just Biden versus Trump, with the exception of the Economist/YouGov poll, although third party candidates got very little support in that survey (Robert F. Kennedy Jr. got just 3%, and the Green Party’s Jill Stein just 1%). That poll is also the only one of the six cited here where Biden does clearly worse among the 65+ age group (trailing 52%-40%) than he does overall (basically tied with Trump, who is up 44%-43%). Generally speaking, YouGov’s demographic crosstabs better reflect 2020 patterns than many other pollsters conducting national polls.
Two of the other polls—from the Republican pollster Echelon Insights and from a bipartisan polling team for Fox News—show very little difference between the topline finding and the results among 65+ voters. The other three, Civiqs for the liberal website Daily Kos, Quinnipiac, and New York Times/Siena, show Biden doing better with the oldest cohort than he is doing overall.
Let’s take a look at the history of how older voters have voted over roughly the past half-century. Table 2 compares the national exit poll from 1976-2020 with the actual national popular vote. For most of these elections, the exit poll reported how those 65 and older voted, but for some of the elections earlier in the timeframe, the exit poll information that is publicly available reported the results of those 60 and older (those are noted in the table in italics). In the far right column, a negative number means that the oldest voters voted more Republican than the nation; a positive number means they voted more Democratic.
Table 2: Oldest voters in presidential elections, 1976-2020
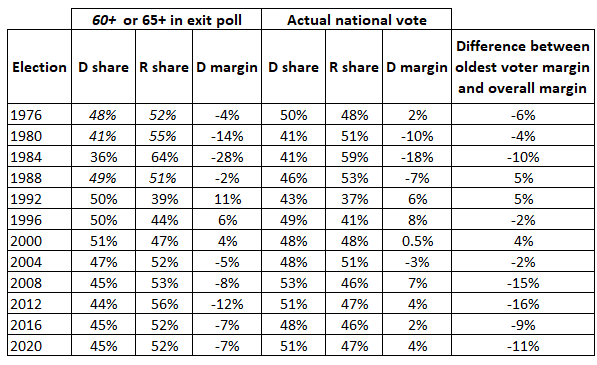
Note: Percentages all rounded except in the Democratic popular vote margin for 2000, given that the margin was only half a point in favor of Al Gore. Exit poll results are for voters 65 and over, with the exception of the years noted in italics, which show results for voters 60 and over.
Source: Roper Center for Public Opinion Research
Notice that it is fairly common, particularly in the four most recent elections, for the oldest group to vote more Republican than the overall electorate. This recent growth in the Republican lean of the oldest voters dovetails with a Democratic trend among the youngest voters. As we showed in a similar table back in the late November story on young voters, the Democratic showing among the youngest voters relative to the overall results spiked in the 2008-2020 range, just as the GOP lean of the oldest voters spiked in the same four elections.
The wide gap between how the oldest voters vote compared to the youngest is backed up by a detailed analysis produced by the Democratic firm Catalist. In the 2012, 2016, and 2020 presidential elections, the Democrat won the 18-29 group by 24 points each time (in the two-party vote) while the Republican won the 65+ group by 6, 8, and 4 points, respectively. So the Democratic margins among young people were bigger than the Republican margins among older people, but the oldest bloc made up a significantly larger share of the electorate (26%, according to Catalist) than the youngest bloc (16%) in 2020. So with one-in-four voters being 65 or older, this is obviously a really important part of the electorate, and it’s not hard to imagine the 65+ vote being a bigger part of the electorate in 2024 if dissatisfaction with Joe Biden among young voters leads to poorer young voter turnout.
Adam Carlson, a former Democratic pollster, has been updating a useful spreadsheet aggregating the crosstabs of national polls and comparing them to what happened in 2020. Across nine polls in March—including some of the ones we noted above—Carlson’s average found Biden up 3 points on Trump among those aged 65 or over, compared to a Trump win of 4 points with that bloc in 2020 based on an aggregate of analyses of the 2020 electorate (including the Catalist report, which we cited above, along with a Pew Research Center analysis and the AP/Fox News VoteCast). Remember, though, that Biden won the national popular vote by 4.5 points in 2020, while the March polling Carlson aggregated showed a Trump lead of 1.5 points. So the polls show the oldest voters getting about 7 points bluer but the overall electorate getting 6 points redder. This is where Biden’s weaknesses with, for instance, young voters and Black voters are making a difference—in Carlson’s polling aggregate, Biden was doing 15 points worse with young voters and 29 points worse with Black voters than he did in 2020. We do think there are reasons to be skeptical of these huge Republican swings among these subgroups based on history and other factors, as I wrote back in November on young voters and Abramowitz wrote last week on Black voters. But there also are reasons to be skeptical of Biden’s overperformance among older voters, too. Part of that is the history—particularly recently, one would not expect the 65+ cohort to vote to the left of the nation in a presidential election.
Now, if Biden actually is doing better with older voters while losing ground elsewhere, there may be some explanations. Younger cohorts appear to be likelier to disagree with Biden on how he has handled the situation in Gaza, for instance. It also may be that some economic challenges, like higher interest rates imposed by the Federal Reserve to fight inflation, are felt more by younger people trying to enter the housing market as opposed to older people who are more established. More broadly, the aforementioned New York Times/Siena poll found that 65 and over respondents were less pessimistic about the economy than the 18-29 group (38% of the former said economic conditions were excellent or good, while just 14% of the 18-29 group said the same). There could be many other legitimate explanations for a real shift in how voter preferences are changing among age groups—the patterns of the past do not always project the future.
However, it is also possible that there is just something strange going on across many different polls that is causing older voters to seem bluer and younger voters to seem redder. Noah Wyhof-Rudnick, director of innovation for the Republican pollster Cygnal, suggested that pollsters may be weighting to 2020 results, and that left-leaning seniors are particularly easy for pollsters to reach compared to other groups, which may have the effect of making seniors as a group look bluer than they are. But, in order to get a sample that looks like the 2020 electorate, other groups may seem redder in order to compensate for that overly blue senior sample. (Wyhof-Rudnick made this point in an X/Twitter thread). It is also worth keeping in mind that 2020 polling also tended to overstate Biden’s eventual showing with older voters, as polling analyst Dan Guild has noted. Right before the 2020 election, some of the pollsters noted above—like Quinnipiac and YouGov—had Biden doing better with older voters than he ultimately performed. We’re not noting this as a “gotcha” to attack these pollsters—we appreciate the data that these and other public pollsters provide. Rather, we just want to note that Biden’s backing among 65 and older voters was often overstated in 2020 and very well may be overstated now.
Beyond that, we also just have to remember that polling is really difficult, and different groups vary in how easy or hard it is for pollsters to reach them. As Center for Politics Scholar Natalie Jackson, a vice president at the Democratic polling firm GQR Research, put it in a recent column: “In short, people don’t want to talk to pollsters. But that’s not even the worst part. The worst part is that certain types of people don’t want to talk to pollsters, and they are different from those who are willing to talk to us. People with less formal education are less likely to talk to us. Young people are less likely to talk to us. Black and Hispanic people are less likely to talk to us. Notice any potential problems there when we’re talking about politics?”
In Trump’s two elections, capturing the full scope of his support was a challenge for pollsters. But go back to 2012, and the polling story was more about missing support for Barack Obama. One can never be quite sure what kind of polling error there might be and whose performance that error might be underestimating or overestimating.
The bottom line here is that just like we are skeptical of poll findings that show Trump winning younger voters outright or making historic inroads with Black voters, we are also skeptical of poll findings that suggest 65+ voters will vote bluer than the nation and/or that show Biden winning that group. This is a very challenging polling environment, and the presence of third party candidates is another confounding variable. We continue to believe that the 2024 presidential election is likely to be very close and competitive and also that there is likely to be a lot of continuity between this election and what happened in 2016 and 2020—when Trump was on the ballot each time and Biden was on the ballot in the latter election. There also is likely to be some change among certain subgroups that will help determine the winner—maybe not as big of a change as some polls may be indicating, but change that will be important to uncover and analyze nonetheless.
Kyle Kondik is a Political Analyst at the Center for Politics at the University of Virginia and the Managing Editor of Sabato's Crystal Ball.
See Other Political Commentary by Kyle Kondik.
See Other Political Commentary.
Views expressed in this column are those of the author, not those of Rasmussen Reports. Comments about this content should be directed to the author or syndicate.
Related Articles

Rasmussen Reports is a media company specializing in the collection, publication and distribution of public opinion information.
We conduct public opinion polls on a variety of topics to inform our audience on events in the news and other topics of interest. To ensure editorial control and independence, we pay for the polls ourselves and generate revenue through the sale of subscriptions, sponsorships, and advertising. Nightly polling on politics, business and lifestyle topics provides the content to update the Rasmussen Reports web site many times each day. If it's in the news, it's in our polls. Additionally, the data drives a daily update newsletter and various media outlets across the country.
Some information, including the Rasmussen Reports daily Presidential Tracking Poll and commentaries are available for free to the general public. Subscriptions are available for $4.95 a month or 34.95 a year that provide subscribers with exclusive access to more than 20 stories per week on upcoming elections, consumer confidence, and issues that affect us all. For those who are really into the numbers, Platinum Members can review demographic crosstabs and a full history of our data.
To learn more about our methodology, click here.