Voters Aren’t Politically Correct And Say Neither is Trump
Voters view so-called political correctness as a problem and see it as a wedge used to silence opposition. President Obama was politically correct, they say; President Trump is not.
The latest Rasmussen Reports national telephone and online survey finds that just 14% of Likely U.S. Voters think Trump is more politically correct than most recent presidents. Seventy-four percent (74%) say he is less politically correct than his recent predecessors, while 10% rate his level of political correctness as about the same. (To see survey question wording, click here.)
By contrast, 62% say Obama was more politically correct than most other recent presidents. Only 19% feel he was less politically correct, and 17% think his level of political correctness was about the same.
How do voters define political correctness? For 37%, it protects groups that have historically been discriminated against. But a plurality (47%) says political correctness is a tool used to silence political and social opponents. Seventeen percent (17%) are undecided.
Most (61%) agree, though, that political correctness is a problem in America today. Only 26% disagree. Twelve percent (12%) are not sure.
Seventy-one percent (71%) of all Americans said political correctness is a problem in this country when Trump raised it in the first Republican candidate debate in August 2015.
Rasmussen Reports invites you to be a part of our first-ever Citizen-Sourced National Midterm Election Polling Project. Learn more about how you can contribute.
(Want a free daily email update? If it's in the news, it's in our polls). Rasmussen Reports updates are also available on Twitter or Facebook.
The survey of 1,000 Likely Voters was conducted on September 17-18, 2018 by Rasmussen Reports. The margin of sampling error is +/- 3 percentage points with a 95% level of confidence. Field work for all Rasmussen Reports surveys is conducted by Pulse Opinion Research, LLC. See methodology.
Most voters believe that school textbooks are more concerned with presenting information in a politically correct manner than in accuracy.
Most voters in all age groups consider political correctness a problem, but those 65 and older are the most likely to view it as a political tool. Blacks are less critical of political correctness than whites and other minority voters are.
Seventy-nine percent (79%) of conservative voters and 59% of moderates see political correctness as a problem. Just 39% of liberals agree. But then 65% of liberals believe it protects groups that have historically been discriminated against, a view shared by only 16% of conservatives and 39% of moderates.
Most Democrats (54%) say political correctness protects those who have been discriminated against. Sixty-six percent (66%) of Republicans and unaffiliateds by a 45% to 34% margin regard it as a political tool instead.
Eighty-three percent (83%) of voters who see political correctness as a political tool regard it as a problem for the country. Interestingly, even among voters who see political correctness as a protection, a sizable 42% feel it is a problem.
One thing the majority of voters in nearly demographic category agree on, however, is that Trump is less PC than most recent presidents, while Obama was more politically correct.
Forty-four percent (44%) of Democrats - and 51% of all voters - agreed with a former Wisconsin Democratic state party chairman in June when he said that "our party right now ... is pickled in identity politics and victimology. ... There is no assimilation of the party anymore."
Nearly half of Americans think college students have less freedom of speech these days, and few think professors and administrators promote the free exchange of ideas.
Eighty-five percent (85%) think giving people the right to free speech is more important than making sure no one is offended by what others say. But only 28% believe Americans have true freedom of speech today.
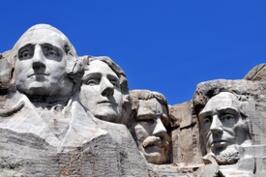
Despite calls by some politicians and the media for erasing those connected to slavery from U.S. history, it looks like George Washington and Thomas Jefferson are going to be with us awhile longer. Voters strongly believe it’s better to learn from the past than erase it.
Additional information from this survey and a full demographic breakdown are available to Platinum Members only.
Please sign up for the Rasmussen Reports daily e-mail update (it’s free) or follow us on Twitter or Facebook. Let us keep you up to date with the latest public opinion news.
The survey of 1,000 Likely Voters was conducted on September 17-18, 2018 by Rasmussen Reports. The margin of sampling error is +/- 3 percentage points with a 95% level of confidence. Field work for all Rasmussen Reports surveys is conducted by Pulse Opinion Research, LLC. See methodology.
Related Articles


Rasmussen Reports is a media company specializing in the collection, publication and distribution of public opinion information.
We conduct public opinion polls on a variety of topics to inform our audience on events in the news and other topics of interest. To ensure editorial control and independence, we pay for the polls ourselves and generate revenue through the sale of subscriptions, sponsorships, and advertising. Nightly polling on politics, business and lifestyle topics provides the content to update the Rasmussen Reports web site many times each day. If it's in the news, it's in our polls. Additionally, the data drives a daily update newsletter and various media outlets across the country.
Some information, including the Rasmussen Reports daily Presidential Tracking Poll and commentaries are available for free to the general public. Subscriptions are available for $4.95 a month or 34.95 a year that provide subscribers with exclusive access to more than 20 stories per week on upcoming elections, consumer confidence, and issues that affect us all. For those who are really into the numbers, Platinum Members can review demographic crosstabs and a full history of our data.
To learn more about our methodology, click here.